Access Assurance: Visualizing Access to Detect Risks
In 2020, as the world was shaken by the emergence of a pandemic, companies had to quickly adapt to remote and hybrid work environments. As an enterprise solution provider that enables employees to work from anywhere, we set out to help organizations gain better visibility into their remote workers' activities and mitigate the risks associated with accessing company resources remotely.
Access assurance was well-received by customers and slated to become the new landing page for Citrix Analytics for Security. The positive reception secured buy-in to further expand the Assurance offering.
Role
Product Designer — UI/UX Design, Interaction, Prototyping, Visual Design
Collaborated w/ Product Manager, UX Researcher, Content Designer, 2 Engineers, Data Scientist.
Time frame
Dec 2021 - Sep 2023 (multi-phased initiative during this period)
Platform
Web (Desktop)

How It All Started 🌱
With employees accessing company resources remotely from different locations and devices, it introduced new challenges for the company’s overall security and impacted the IT and security teams (SecOps) who assess risk and monitor threats. Security teams typically review log files to get access data which can be time consuming.
They needed help understanding where and how employees are accessing company resources in order to protect the employees and the organization from potential security threats.
Discovery to Direction 📌

Our customer goals:
Visibility of user access and activity
Ability into drill down and investigate
Ability to set parameters of what is anomalous
Ability to set actions on anomalous behavior detected
Our business goals:
Increase active use and product value of CAS/S
Positive impact to customer license renewal + activation
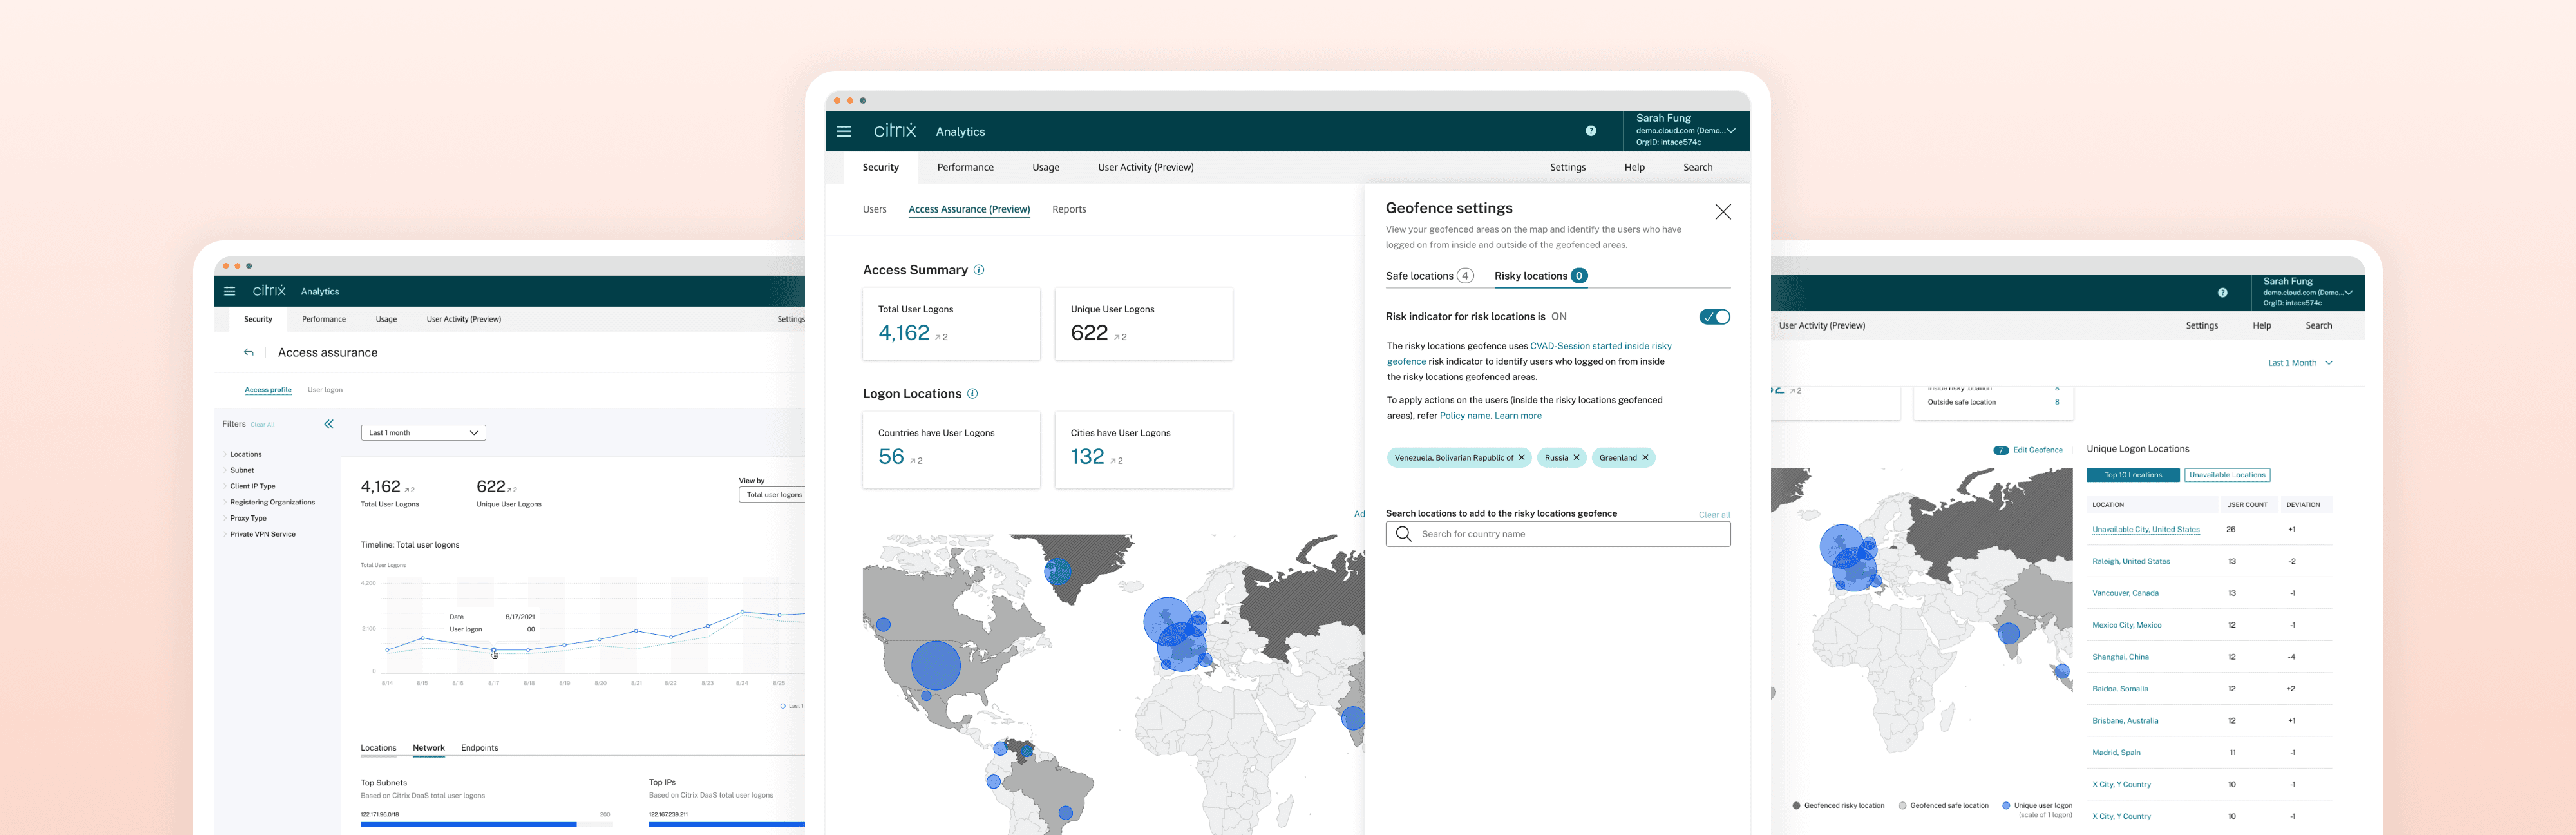
The Access Assurance dashboard includes two key features that help admins (1) gain visibility into where employees are accessing resources from and (2) take action by defining parameters and automating responses to risky behavior. The following sections outline the design approach for each:
Map visualization — where I fine tuned the visual and interaction design
Geofencing — where I seamlessly connected the map visualization, geofence creation, risk indicators, and policy setup into a cohesive user flow
Map Visualization 📌
The map visualization is an effective way to show trends and insights associated with geographical locations. For access assurance, I needed to consider 3 dimensions:
Locations of access
No. of users accessing from location
Geofenced locations (safe or risky)
After researching various map visualizations, I chose the geographic bubble map to clearly show the magnitude of the data value where locations with large number of access reflect a large bubble. I explored options to define the bubble map details such as: map frame width, bubble opacity, bubble border stroke, bubble min and max size, etc.
The width of the map frame went through various explorations. Citrix Analytics is a data heavy product filled with summary metrics, tables and lots of text and numbers. So, I was inclined to make the map a prominent piece of the dashboard and went full width initially. I weighed out the pros and cons for a few options. I chose option D because it allowed for both a moderately sized map for interactivity and space for a table which complements the map's data.

Bubble attributes
The bubble attributes (opacity, border, etc) required a bit of fine-tuning. Since the bubbles overlay the map, it was crucial to test varying levels of opacity. I chose a 50% opacity with a solid border stroke of 1.5px after some explorations. A medium opacity allowed for more defined bubble plots without losing the country borders. The more transparent the bubbles were, the bubbles and lines were blurred and washed out and lost readability.

Map colors
After designs have been delivered, it's important to me to remain involved during the implementation process. As I was reviewing the map visualization, I noticed the map color was not in line with that I had provided in my designs. The engineer had used the color noted, but it did not translate the same. So, I worked closely with the engineer, got access to Mapbox to quickly troubleshoot and ensure the location labels were legible and ensured I called out all the changes clearly for the engineers.

Geofencing 📌
Geofencing is a key component to the access assurance dashboard. It allows customers to define what locations are considered safe versus risky in their organization. With this user input, we correlate it to the geofence risk indicator and inform the user to create a policy to apply any actions to safeguard their users and resources.
Based on all the requirements, I developed a user flow which helped shape up the geofence configuration blade design to ability to:
Add or edit a geofence
Connect the geofence to the risk indicator
Connect the geofence to the policy
View the visualization reflected on the map (access locations + geofence)
After many explorations for the geofence blade, I had 2 options that I was weighing. One option was a ‘single view’ approach where the user would choose a location from a searchable select dropdown and view the selections as chips — all in a single view in a blade. The second option was a guided ‘multi-view’ approach where the user would enter an “edit” mode to choose locations from a searchable select dropdown. After the selections are made, then enter a “view” mode of all confirmed selections.

After reviewing with the design team, a usability test, getting input from engineering and weighing out the pros and cons of both options, I chose option A (single view). This geofence blade approach offered a simple user flow without having to toggle between a view and edit mode. This also helped with the time constraint engineering had working against them. With this, I delivered the 1st iteration of access assurance with geofencing.
Challenges of Navigating the Unknowns 🥊
This feature had many twists and turns — from shifting timelines to changing scopes and resources. It demanded a lot of adapting, troubleshooting, and working through unknowns.
Unknown locations
One major edge case surfaced during the tech preview phase: “unknown locations.” Unfortunately, this was not anticipated during early product planning or stakeholder discussions.
We quickly investigated and learned that our third-party integration (MaxMind) translates IP addresses into locations, but sometimes it can't determine precise details like a city — or any location at all. This can happen due to unsupported client versions, private IPs, or other limitations. Engineers flagged three types of null values:
“Unknown city” with a known country
“Unknown city/country” (no location details available)
“Unknown city/country” due to private IP addresses
A data scientist analyzed the location data and found that most customers would experience null cases — and 99% are due to private IPs. Her insights were key in informing the design.
After many iterations, I designed a second tab to display "Unavailable Locations" separately, keeping the primary "Top 10 Locations" view clean and useful. Partially unknown entries (where at least the country was known) remained in the Top 10, since they still provided valuable context (e.g., “United States”). To further help admins, I added tooltips explaining each type of unknown location when hovered if necessary.

Results & Looking Ahead 📈
Preliminary qualitative feedback indicated strong early reception. Product managers shared that customers expressed enthusiasm for the feature during regular check-ins, and there were plans to make Access Assurance the new default landing page for Citrix Analytics for Security.
As this was a brand-new offering, I had hoped to continue learning from its post-launch performance. Unfortunately, due to an organizational restructure, my role was impacted before I could follow through. Had I remained on the team, my next steps would have included:
Analyzing adoption and usage data of the dashboard and geofencing
Evaluating how this feature influenced engagement with the broader Citrix Analytics platform
Gathering feedback on the visual and interaction design of the map experience
While I didn’t get the chance to gather performance metrics or see the next phases through, I’m proud of the foundational work I contributed to this meaningful product evolution

